QR Code Analytics
You can gather QR Code analytics for any QR Code that you take live via Producer. This way you know exactly when, where, and how your audience is engaging with your content!
To get started, you'll need a Graphic or Custom Poll Result that has a QR code. Haven't built them yet? Start here ⬇️
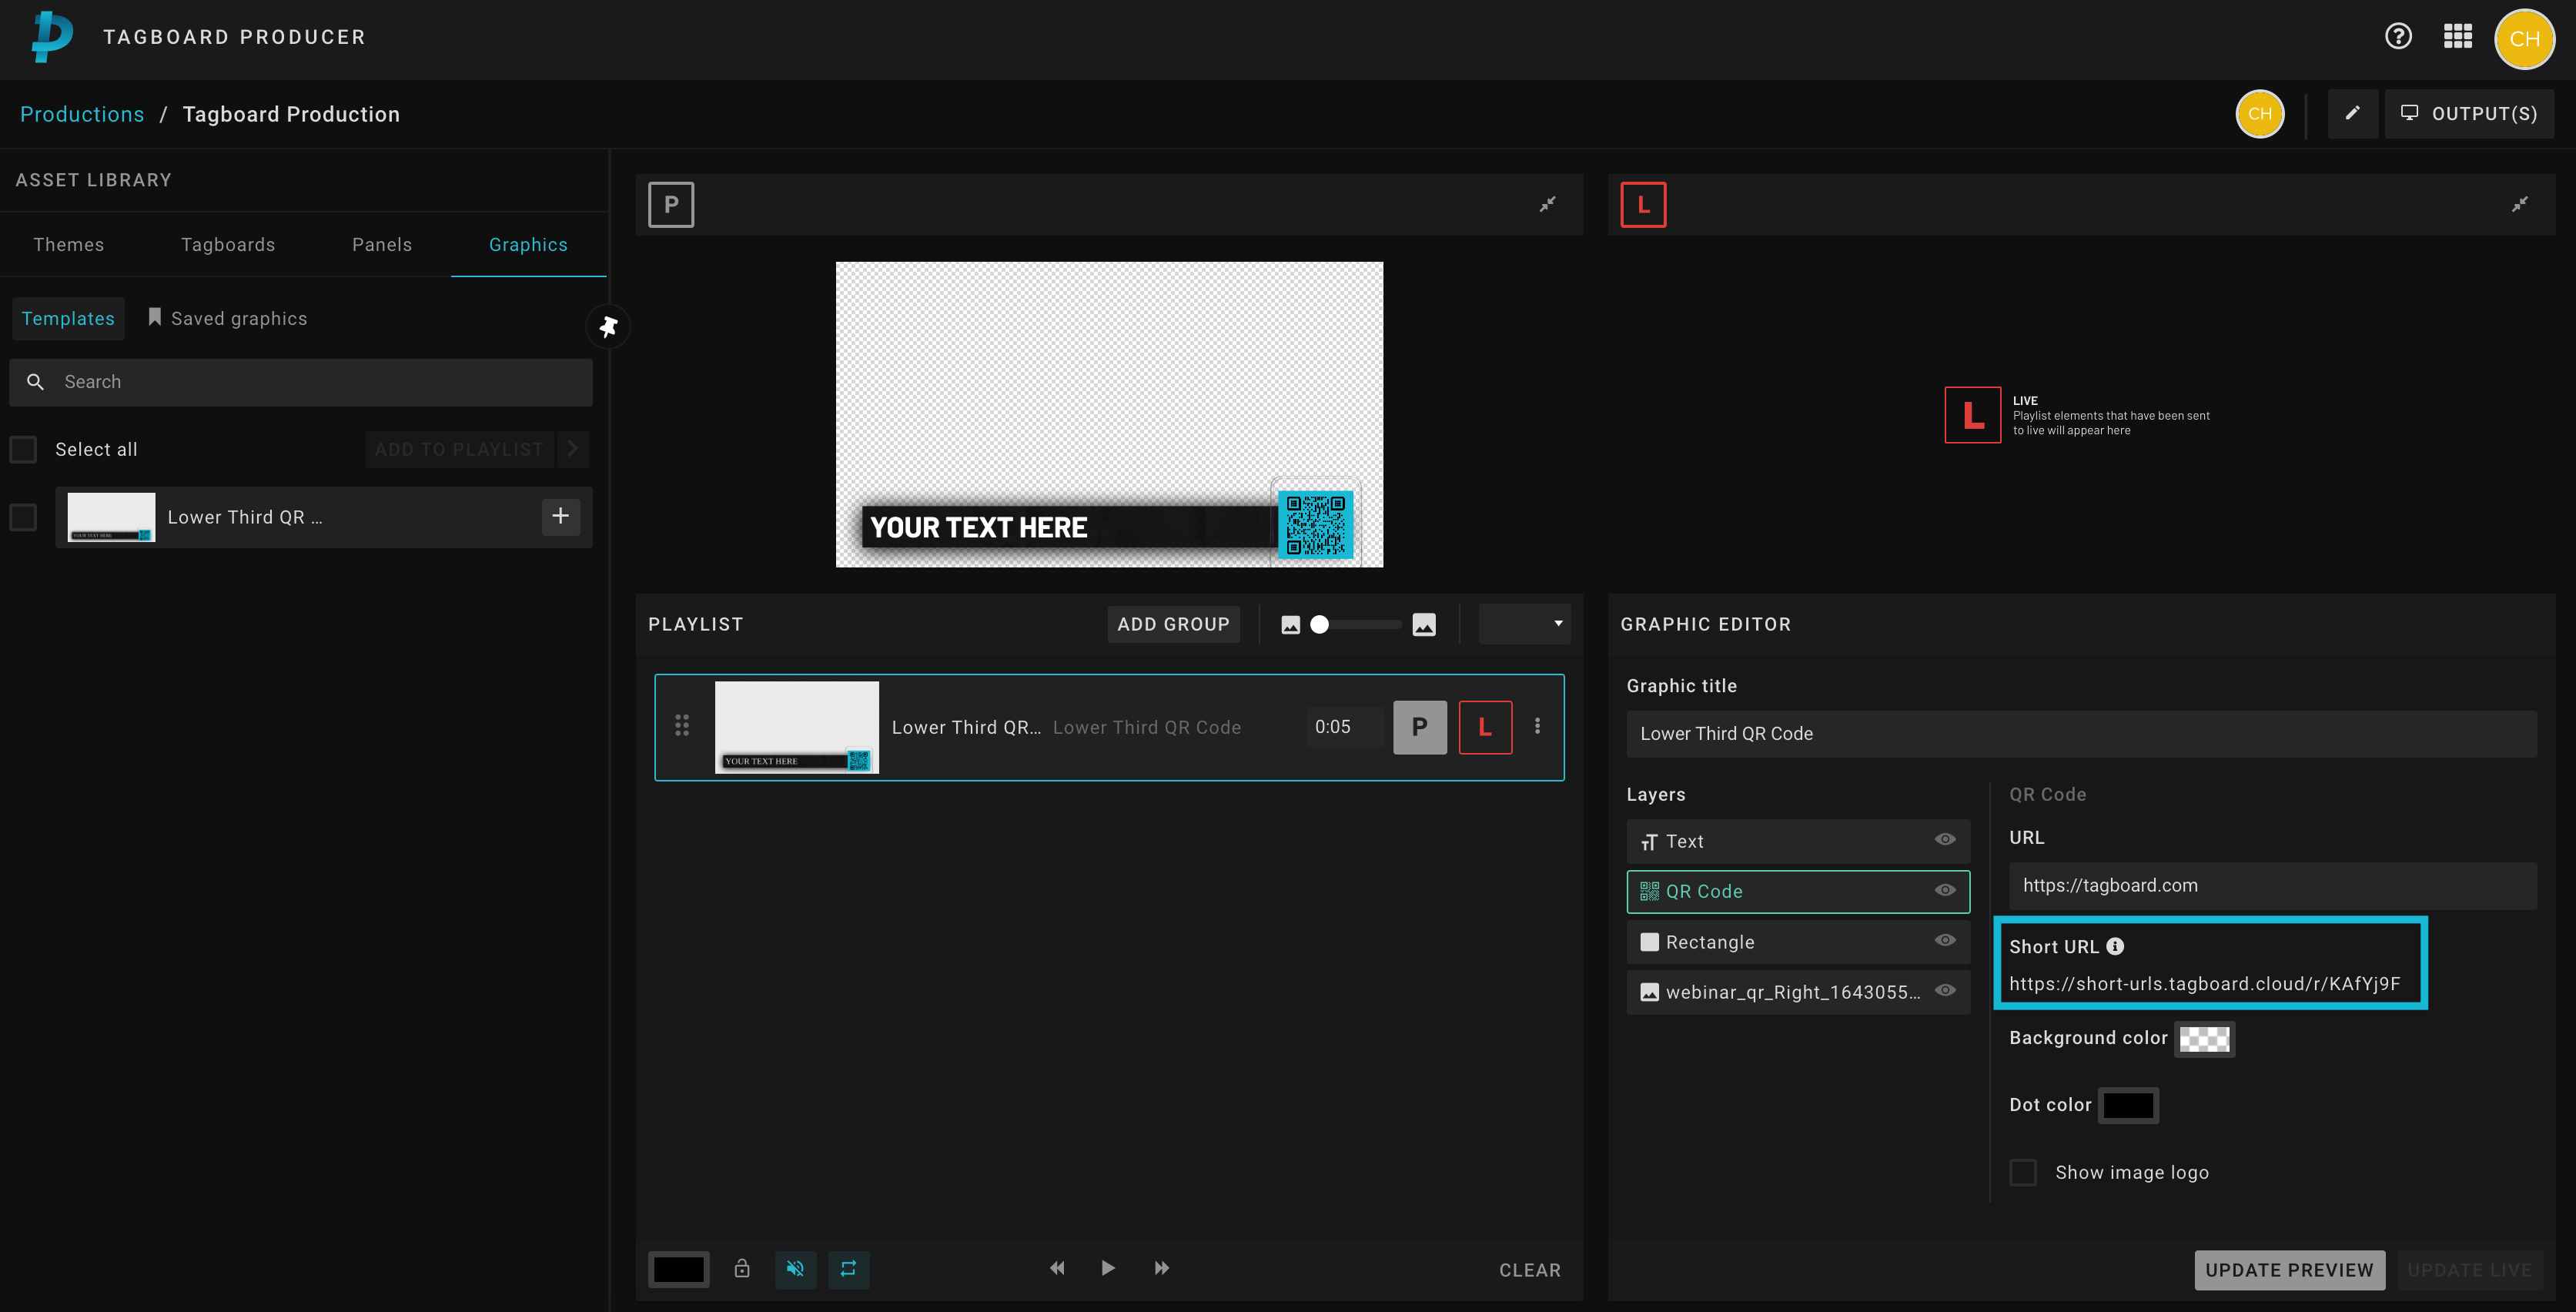
Once you put the Graphic or Custom Poll Result into your Playlist in Producer, Tagboard will automatically generate a short URL. This is what enables tracking of scans and analytics. Any time you update the URL destination for your QR code, Tagboard will automatically generate a new short URL.

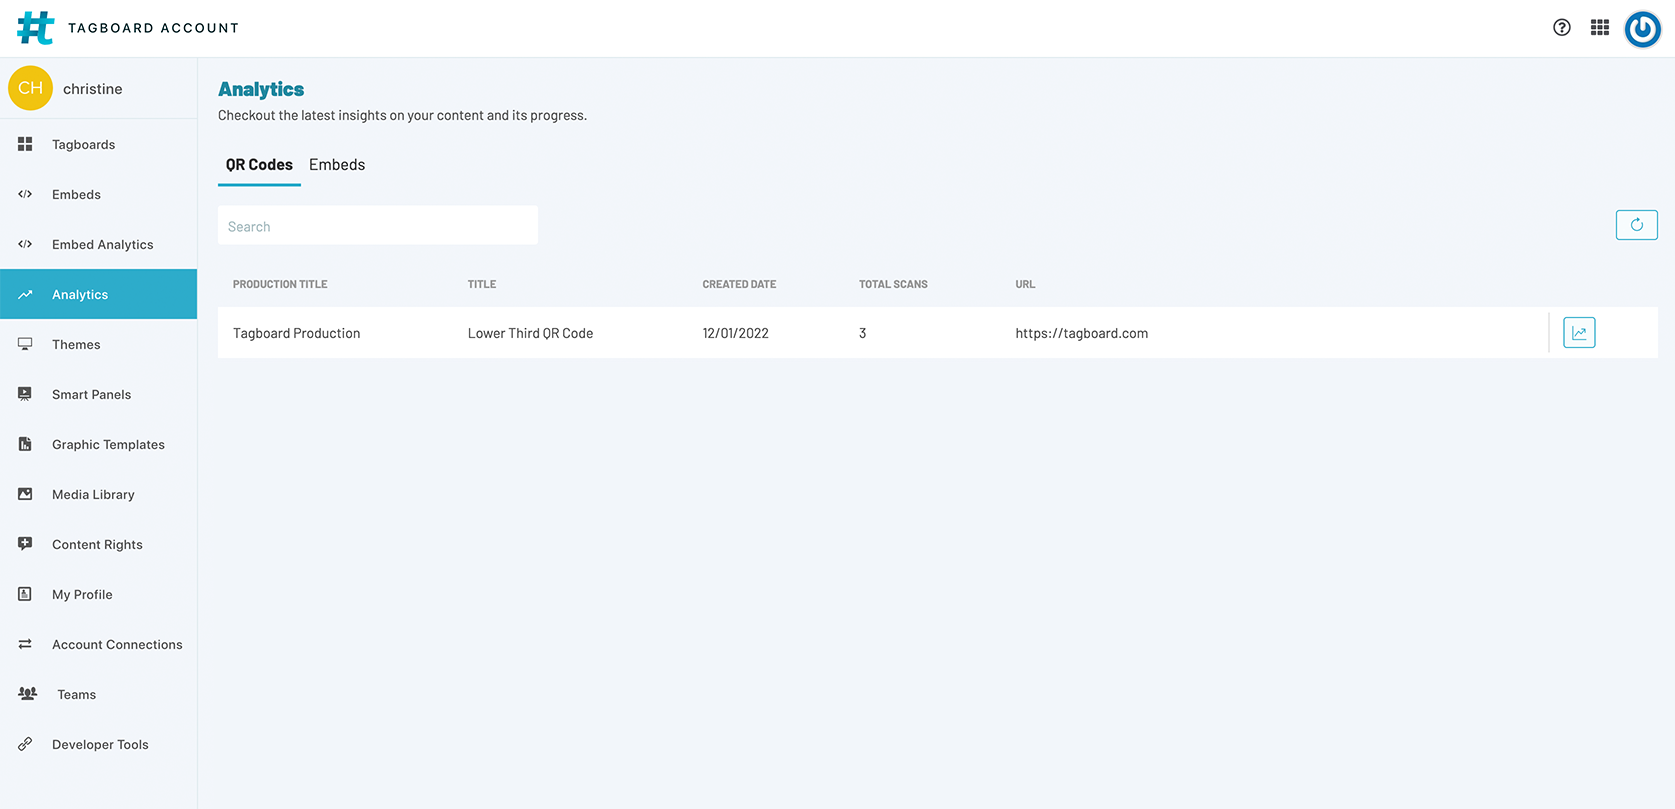
After you go live, you can view your QR code analytics by selecting 'Analytics' on the left side of your Account Dashboard.

A new analytics entry will be made every time a new Graphic or Panel with a QR code is added to your Playlist or every time the URL is updated.
If you take the same Graphic or Panel from your playlist live multiple times during your show, the scans will be combined on one analytics entry.

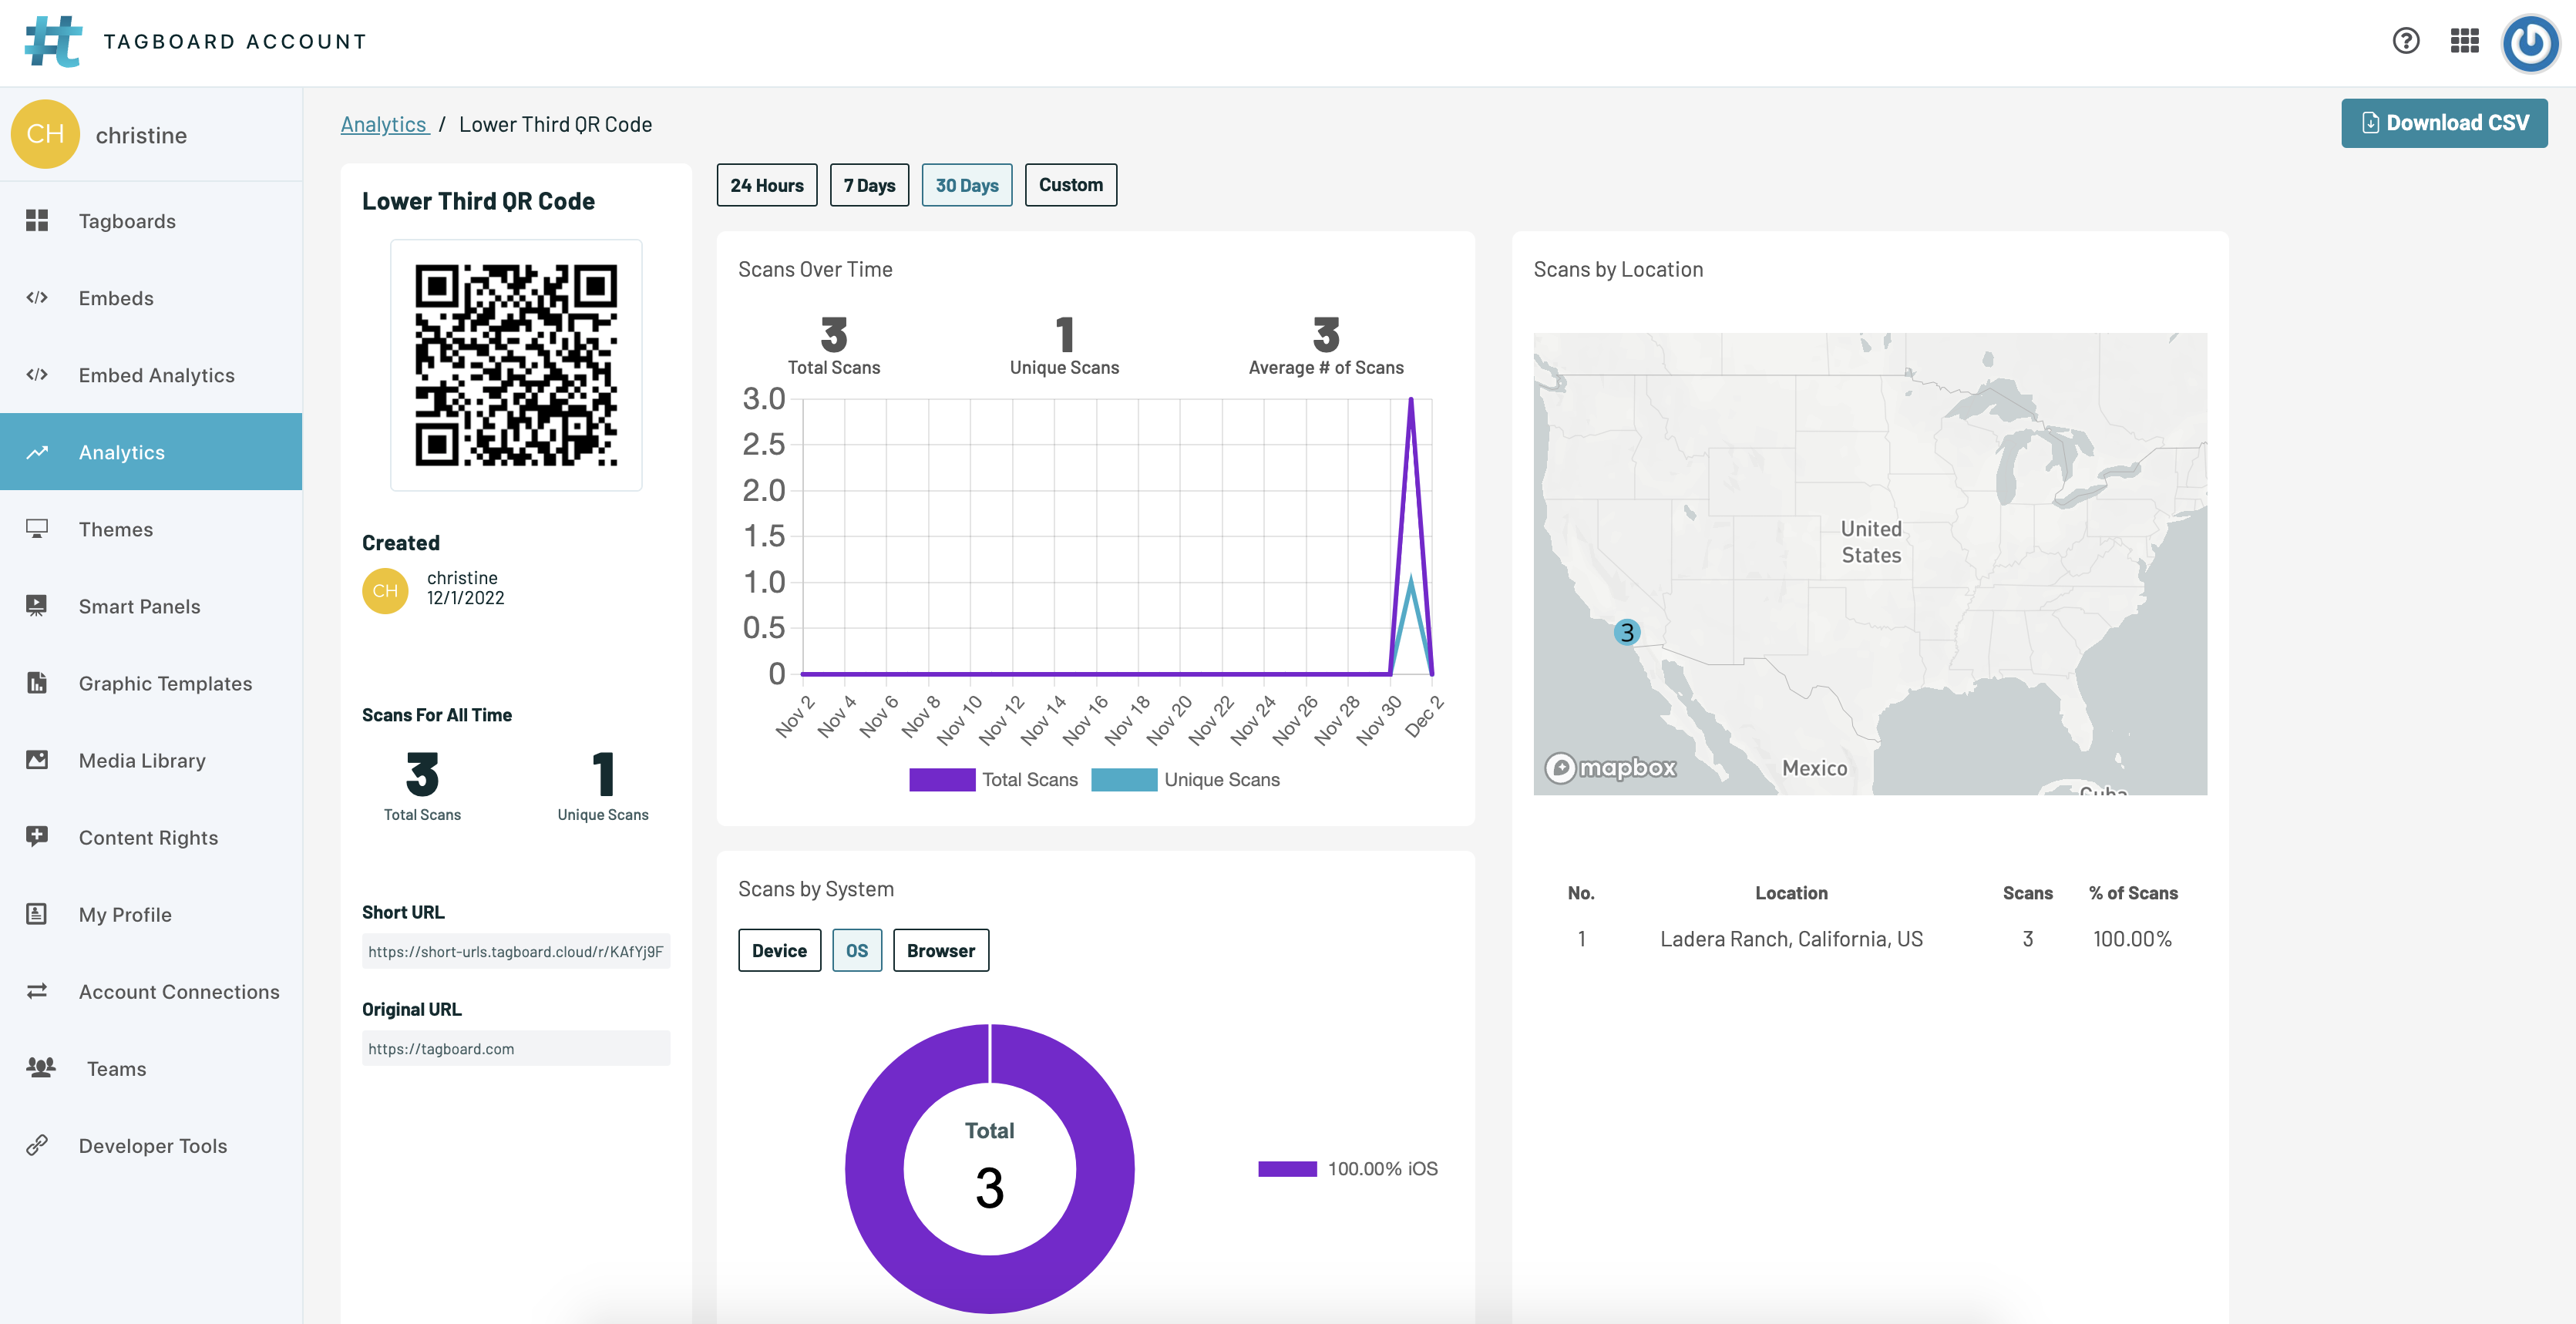
In each analytics entry, you will have access to the follow data:
-
Scans over time
-
Total scans: the overall number of scans of the QR code
-
Unique scans: the number of unique devices that scanned the QR code
-
-
Scans by system: details on device, OS, and browser
-
Scans by location: Tagboard captures the scanner's IP address to determine their approximate location
You can download a CSV of in-depth data by clicking the button in the upper right corner. This will also include date and time of each scan and postal code of the scanner.
.png?width=300&height=50&name=kb-logo-alt%20(1).png)