Before Getting Started
You will need to have a Sportradar license to access Sportradar within Tagboard. Click here if you'd like to learn more about purchasing a license. If you already have a Sportradar license, contact your CSM to activate it within Tagboard. There are separate licenses for each sport, as well as logo and headshot images.
Adding Sportradar Content in Graphics
Step 1
- Add to an Existing Graphic: Open an existing graphic by either searching for it in the search bar at the top of Creator, or click the Graphics tab and find it in your list of Graphics.
- Create a New Graphic: Select "+ Create New", which will pop open a modal for you to choose one of several ways to create a graphic [see a - d, immediately below]
-
- Create a new graphic from scratch
- Create a new graphic via Photoshop upload
- Create a new graphic via copying an existing graphic
- Create a new graphic via a template (recommended)

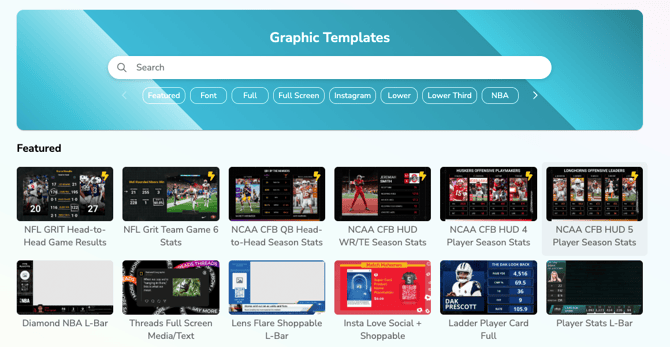
💡TIP: We already did the hard work for you! We have a vast Template Library with ready-made mapped Sportradar data sets. All you have to do is pick the look you like and update your design assets, like background imagery and custom fonts. Search by keywords, league or design style. Then, change out data points in Creator and/or Producer any time. This video walks you through it!
Step 2
After choosing your graphic type, select "Advanced Elements’" on the left sidebar of your Graphic Builder. Once selected, a menu will pop out where you will click on "Sportradar" and then choose your league. If you started with a template, this step will already be done for you.
Step 3
Next, select the type of data you want to display. You can choose in-game stats or season stats, both for an individual player or for a team.
Step 4
Search for and select the data/stats you want to display.
Note: The data is defaulted to the most recent season [and game, if applicable] as well as alphabetically by team and player’s first name. This data is just a preview and will act as a placeholder in the canvas. You can cycle through as well as replace, remove, and/or add data from the canvas at any time.
Step 5
Position each layer of data within your graphic. Remember, this is just a template to map your data. You can remap stats any time as well as update the team, player, and type of stats you want to display, in either Creator or Producer.
Note: Once you’ve selected a layer you will see a sidebar appear on the right side of the builder. Here is where you can make adjustments [text size, color, and/or alignment as well as other options] for each layer. Select multiple layers at once by holding Shift. When multiple layers are selected you can choose different alignment options. In this case, centering the headshot on the background.
Additional Resources
Add More Stats, Headshots, and/or Team Logos
Realizing you’d like to include more stats, headshots, and/or a team logo? You can add these to your graphic by clicking the “+” symbol next to the Sportradar layer on the left sidebar. Then you will be able to select “text” or “image” [team logo or player headshots].

When choosing “text” you can choose whether or not to include the text description. Once the additional stats are added, you will need to format the new text and values to match your styles.
Connecting Additional Data Values
You can connect data from Sportradar with text and shape elements. As long as these elements are dragged and dropped into the Sportradar group, they can have data applied to them.
Text and/or shape colors can change when changing the team referenced. This can be for backgrounds, title bars, and more.


Going Live
Now that you’ve (1) connected Sportradar data into your graphic and (2) customized the design and layout, it’s time to display them on screen. Once this graphic has been saved, it will appear in your Asset Library in any production in Producer. You can drag and drop that content onto your Playlist and display it on your Output.
You can change the season, team, player, game and stat types within a production. While in Producer, select the graphic in your Playlist. Then select “Sportradar” and you will see the options to make the changes you need.

❓ Frequently Asked Questions ❓
Do I need Sportradar API Keys? How do I get them if I don’t have any?
You do not need Sportradar API Keys to utilize Sportradar data in Graphics. The access to data can be purchased through Tagboard. Contact your CSM for more information. Once purchased, we will turn on access to the appropriate leagues/sports in your account.
For access to use Sportradar images [headshots and team logos], you will need Sportradar API Keys! Contact Sportradar to discuss your options.
What leagues/sports does Tagboard support?
Tagboard currently the following leagues:
- NBA
- NFL
- NHL
- MLB
- MLS
- FIFA World Cup (2026)
- Premier League
- NCAAF (College Football)
- NCAA Men's and Women's Basketball
- NASCAR (Cup Series, Craftsman Truck Series, O'Reilly Auto Parts Series)
What data is available?
Statistics from the preseason, regular season, in-season tournament, and postseason games are available.
How often is the data updated?
Latency may vary depending on league, conference, and broadcast rights carrier. To see how often Sportradar data is updated, please refer to their documentation. Once the data is updated from Sportradar, Tagboard updates the data in near real-time.
Do you have the free agents data available?
Currently, Tagboard does not support free agents.
Why don’t I see the team logo or headshot for the player?
You need Sportradar API Keys for player headshots and team logos.
Contact Sportradar for additional information if you do not have keys. (Note, Sportradar does not support logos for NFL.)
What timezone is the data in? How do you calculate efficiency? What do some of these acronyms mean?
For additional information, please check out Sportradar’s documentation here.